Monitoring a Stock Portfolio's Performance


The final step in the stock portfolio investment process is to monitor the portfolio's performance and compare the performance to that of a benchmark. The primary task in this hub is to give you ideas on how to measure the entire portfolio's return and relate it to the risks incurred in achieving that return.
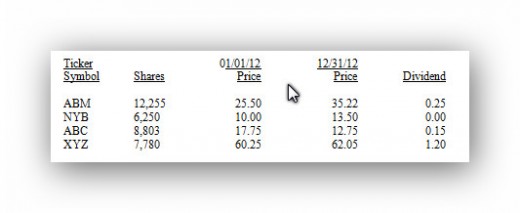
Let's take a look at the index portfolio below. From the information given, we are going to calculate the holding period return for the portfolio. The holding period is the length of time an asset is held by the investor and the return is the profit gained over that period.
The Holding Period Return on a Portfolio
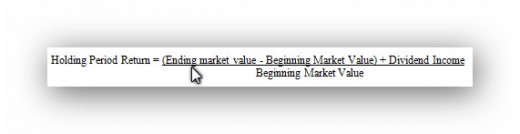
The holding period return of an investment is given by the formula below. You will notice from the formula. that you must include any and all dividends received, in the calculation.
Holding Period Return
Let's take a look at the index portfolio below and from the information we have we are going to calculate the holding period return for the portfolio.
Index Portfolio
If we follow the formula the calculation would be this:
($1,110,983.35 - $1,000,000) = $110,983.35
= $110,983.35 + $13,720.20 = $124,703.55
= $124,703.55 / $1,000,000 = 12.50%
The way we get the beginning and closing market values is by multiplying the number of shares by the share price at the beginning of the period and at the end of the period. The dividend income is the worked out by multiplying the dividend by the number of shares.
Usually, though, we are concerned about the return of a portfolio over several periods. A portfolio's rate-of-return is not simply the average of rate of return over several individual periods. Instead, we must calculate the portfolio’s average compound rate-of-return.
To understand the difference, look at both of these formulas and the portfolio. The simple average weighs a given percentage increase the same as a given percentage decrease.
Simple Average: (11.3 + 20.0 + 0.0 - 11.1 - 15.8) / 5 = 0.88 percent
Compound Average: (1.113*1.20*1.0*0.889*0.842)1/5 - 1 = 0.00 percent
Average Simple Return/Compound Return
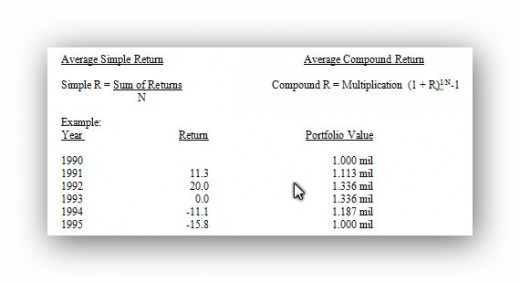
Take the above set of returns with our portfolio that has a beginning value of $1 million. Notice that the simple rate of return indicates a 0.88 percent average gain over the 5 years. However, the portfolio at the end of 1995 has the same value of $1 million. The compound rate of return shows us an average compound gain of 0.
By the way, a return that is – 11.1 is converted to ‘1’ by adding moving the point back two decimal places and taking away the minus sign = 0.111 and adding 0.889 so it equals 1.
Let’s look at the following returns and see the results of the calculation of the annual portfolio for the 5 year period using both the simple average and the compound average.
Return Over Portfolio Value
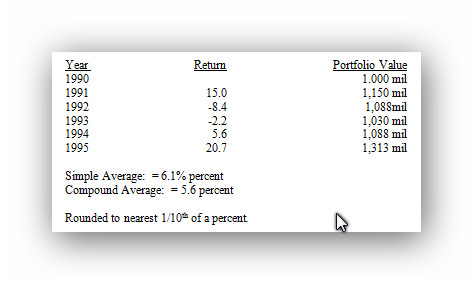
Simple R = 15-8.4-2.2+5.6+20.7 / 5 = 6.1%
Compound R = (1.15*0.916*0.978*1.056*1.207) 1/5 - 1 = 5.6%
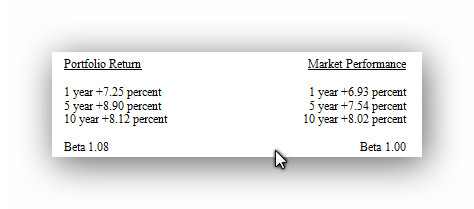
In evaluating performance, investors must compare the average compound return against the market performance. Therefore the policy statement should reveal the benchmark index to which the actual performance should be compared. The most common index used as a benchmark for large capitalization stock portfolios is the S&P 500 Index.
It is important to also evaluate the risk level assumed in achieving the portfolio return. Managers generally use the CAPM as a basis for comparing risk. Thus, they use the portfolio's beta as a measure of relative risk.
Portfolio Beta
A Beta which is greater than one indicates that the stock moves in the direction of the market but in a bigger amount than the market.
Many clients, in particular institutional investors, have fiduciary responsibilities. In addition to investment performance, they will evaluate the portfolio manager's skill at allocating capital and selecting securities adherence to their investment policy, and the impact of transaction costs and management fees. Investment performance evaluation is, therefore, only one aspect of monitoring progress towards goals and modifying investment objectives.


